Visualizing the Process of Process Modeling with PPMCharts
Jan Claes, Irene Vanderfeesten, Jakob Pinggera, Hajo A. Reijers, Barbara Weber, Geert PoelsBPM 2012 International Workshops - TAProViz workshop, LNBIP 132, p. 744-755, 2012 (proceedings acceptance rate: 40%)
The final publication is available via https://dx.doi.org/10.1007/978-3-642-36285-9_75

Abstract. In the quest for knowledge about how to make good process models, recent research focus is shifting from studying the quality of process models to studying the process of process modeling itself. This paper reports on our efforts to visualize this specific process in such a way that relevant characteristics of the modeling process can be observed graphically. By recording each modeling operation in a modeling process, one can build an event log that can be used as input for the PPMChart analysis plug-in we implemented in ProM. The graphical representation this plug-in generates allows for the discovery of different patterns of the process of process modeling. It also provides different views on the process of process modeling (by configuring and filtering the charts).
Additional material.
- The figures:
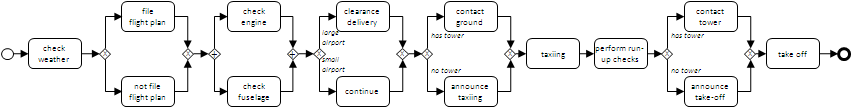
Figure 2: Process model as result of the modeling process in Fig. 1
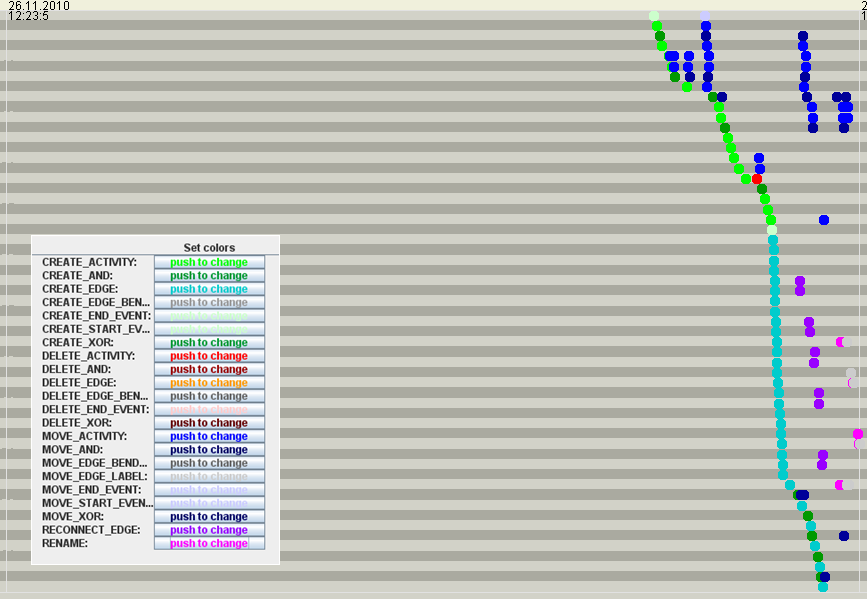
Figure 3: Screenshot of the PPMChart window in ProM
Figure 4a: Number of created model elements and duration of the modeling process
Figure 4b: Number of created model elements and duration of the modeling process
Figure 4c: Number of created model elements and duration of the modeling process
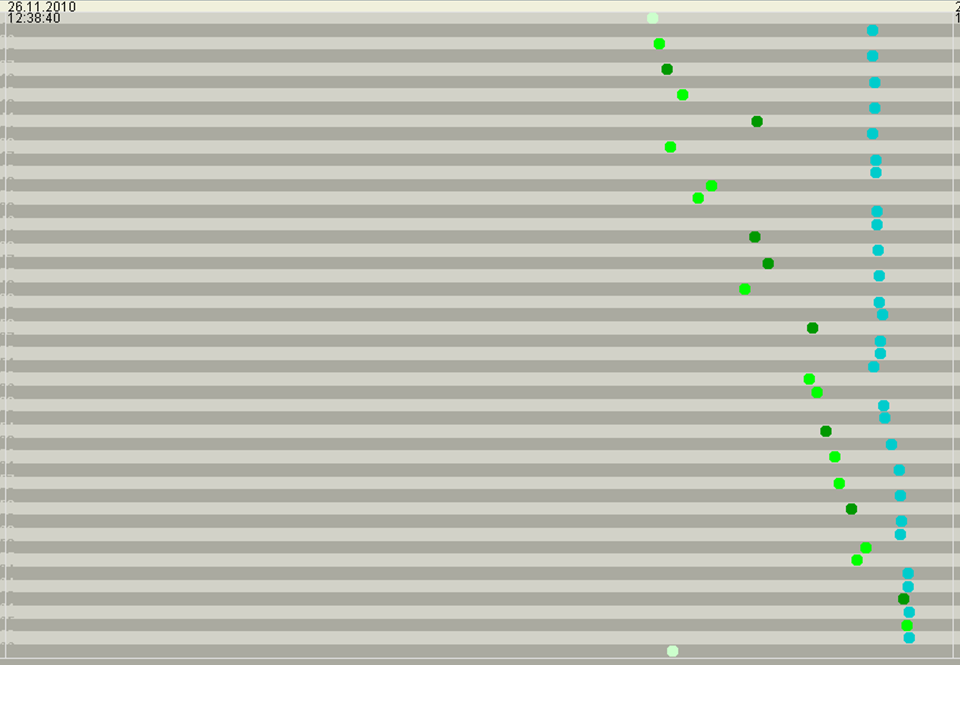
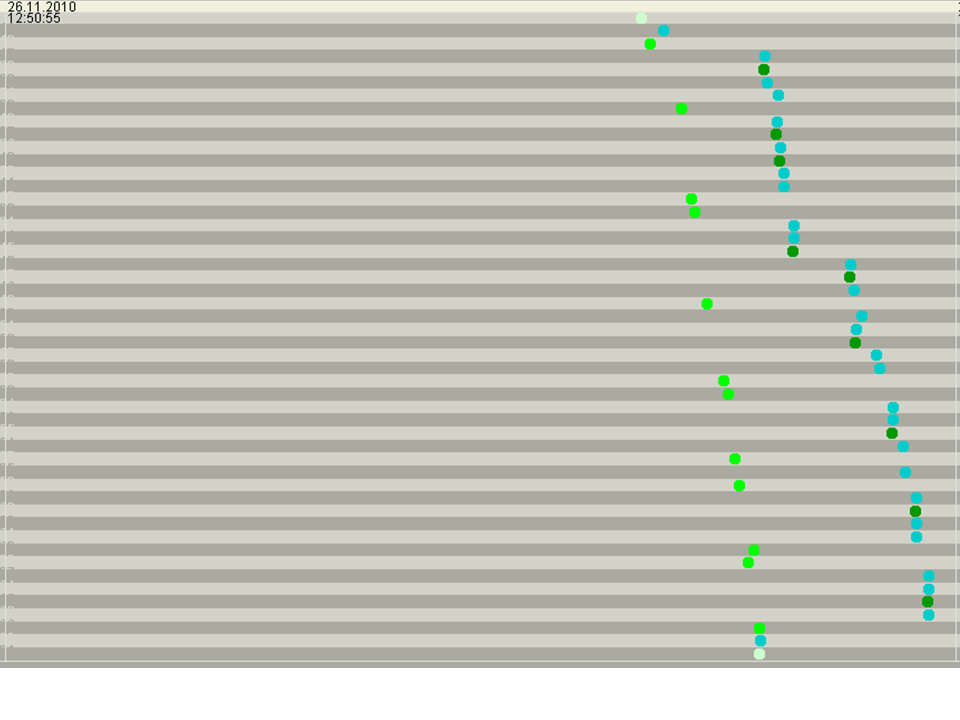
Figure 5a: Order of creating and changing model elements (sorted by First event)
Figure 5b: Order of creating and changing model elements (sorted by First event)
Figure 5c: Order of creating and changing model elements (sorted by First event)
Figure 6a: Order of creation of elements (view: only create operations; move / delete filtered out)
Figure 6b: Order of creation of elements (view: only create operations; move / delete filtered out)
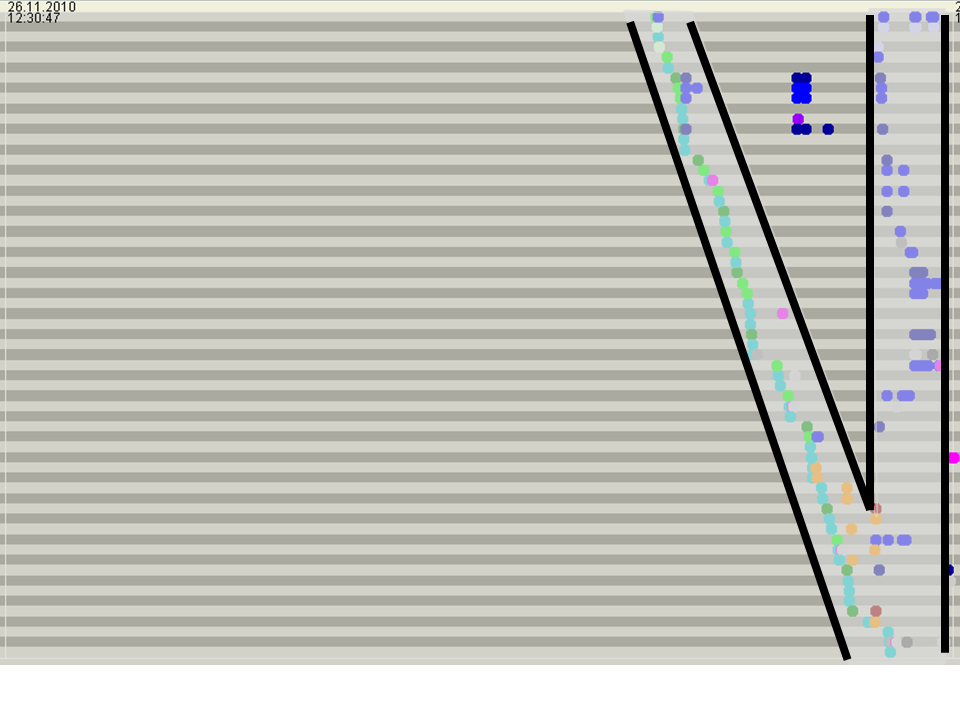
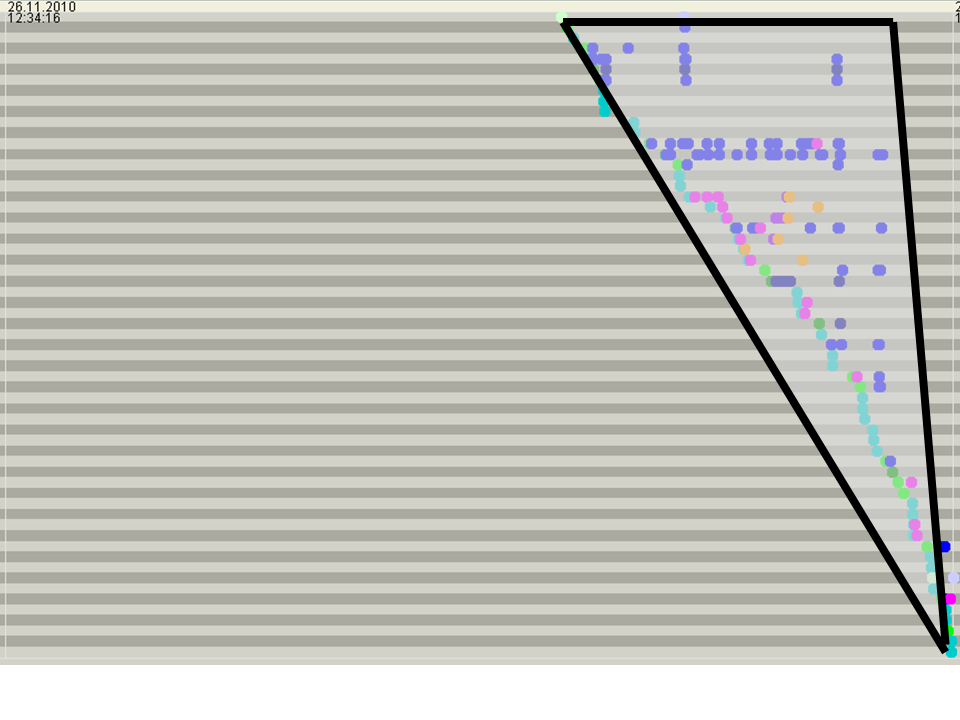
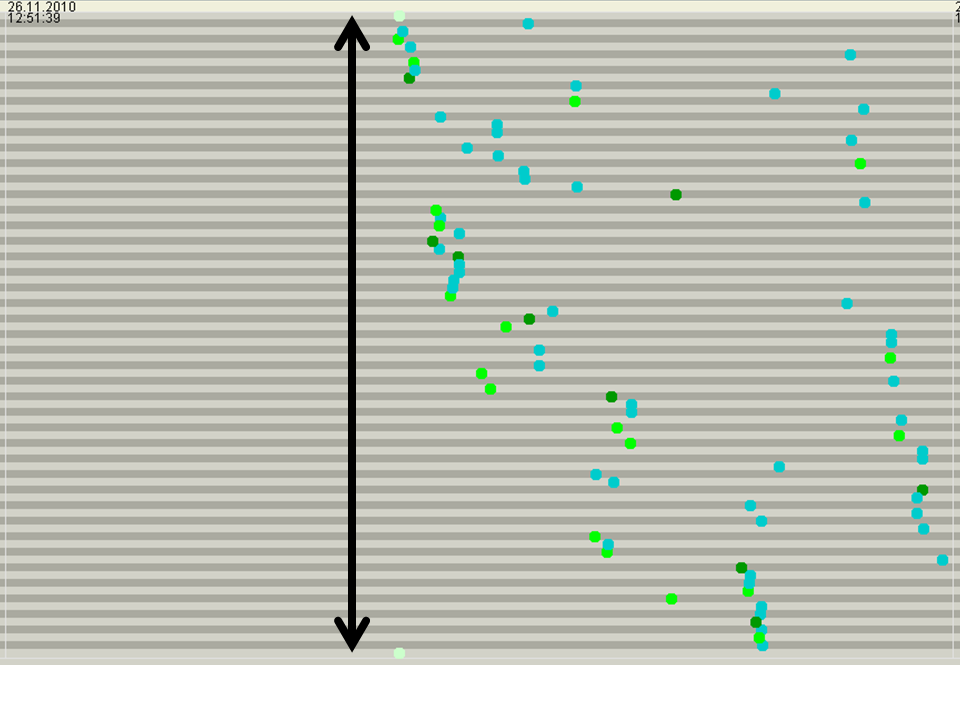
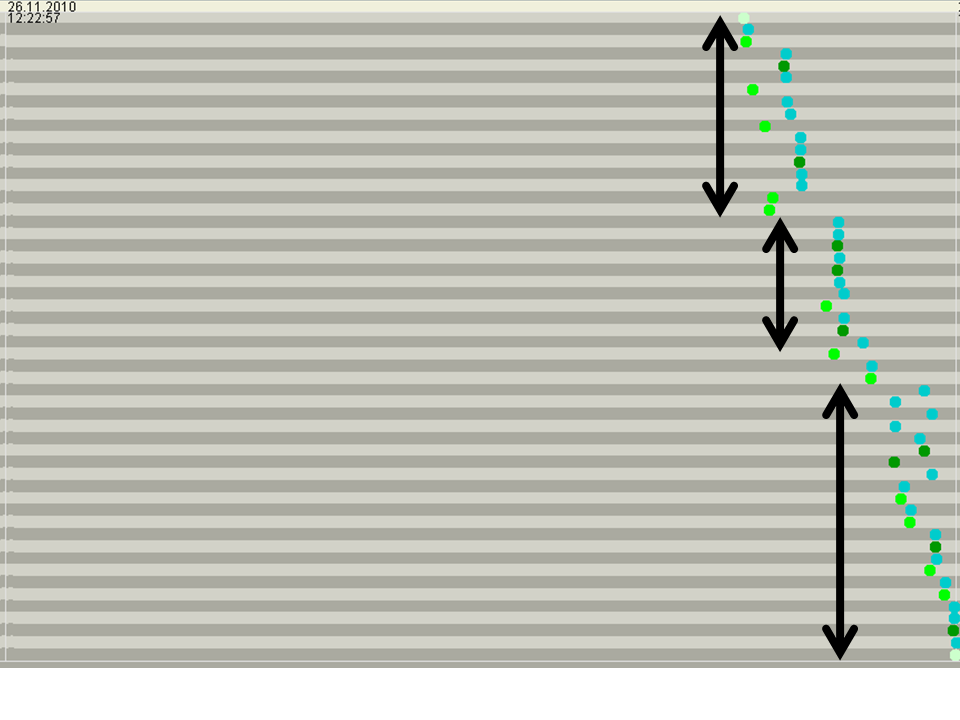
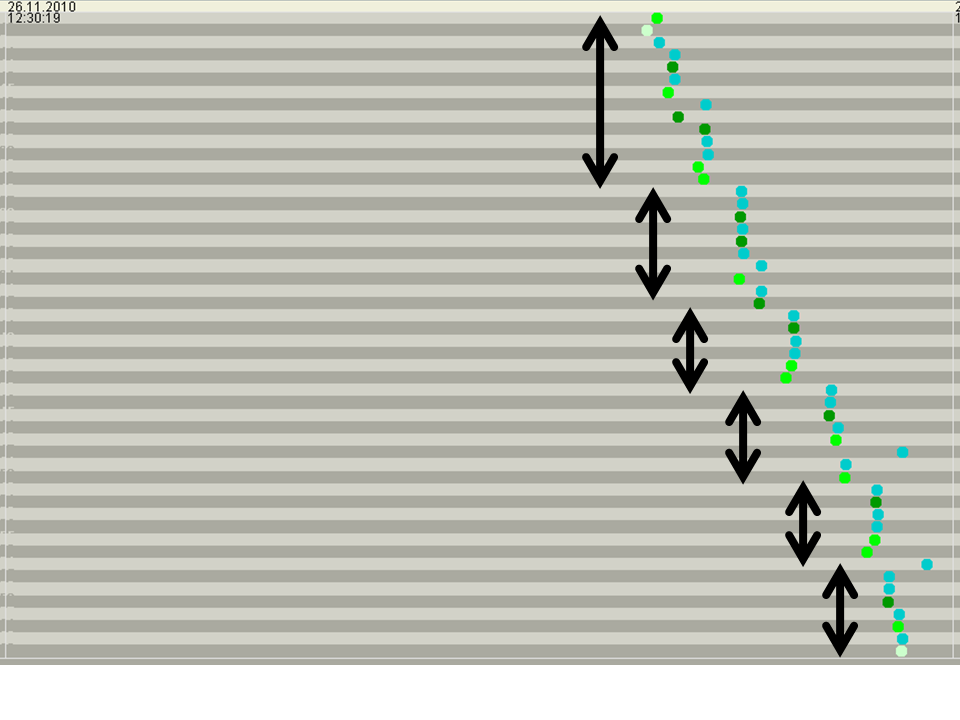
Figure 7a: Chunked process modeling (sorted by Distance from start, only create operations)
Figure 7b: Chunked process modeling (sorted by Distance from start, only create operations)
Figure 7c: Chunked process modeling (sorted by Distance from start, only create operations)
Figure 8: Example of a "block" in a model
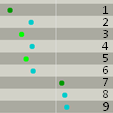
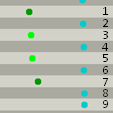
Figure 9a: Order of constructing blocks. The numbers correspond with the numbers in Fig. 8. (sorted by Create order from start, only create operations)
Figure 9b: Order of constructing blocks. The numbers correspond with the numbers in Fig. 8. (sorted by Create order from start, only create operations)
Figure 9c: Order of constructing blocks. The numbers correspond with the numbers in Fig. 8. (sorted by Create order from start, only create operations)
Figure 9d: Order of constructing blocks. The numbers correspond with the numbers in Fig. 8. (sorted by Create order from start, only create operations)
- The presentation:

